No single indicator reliably marks a Bitcoin bear market bottom on its own. Production cost proximity, volatility spikes, and price drawdown depth each capture a distinct dimension of market stress — and it is the simultaneous presence of all three that has historically coincided with major cycle lows. This note formalises that confluence into a quantitative framework, explains the construction of each signal, and documents its historical track record back to 2014.
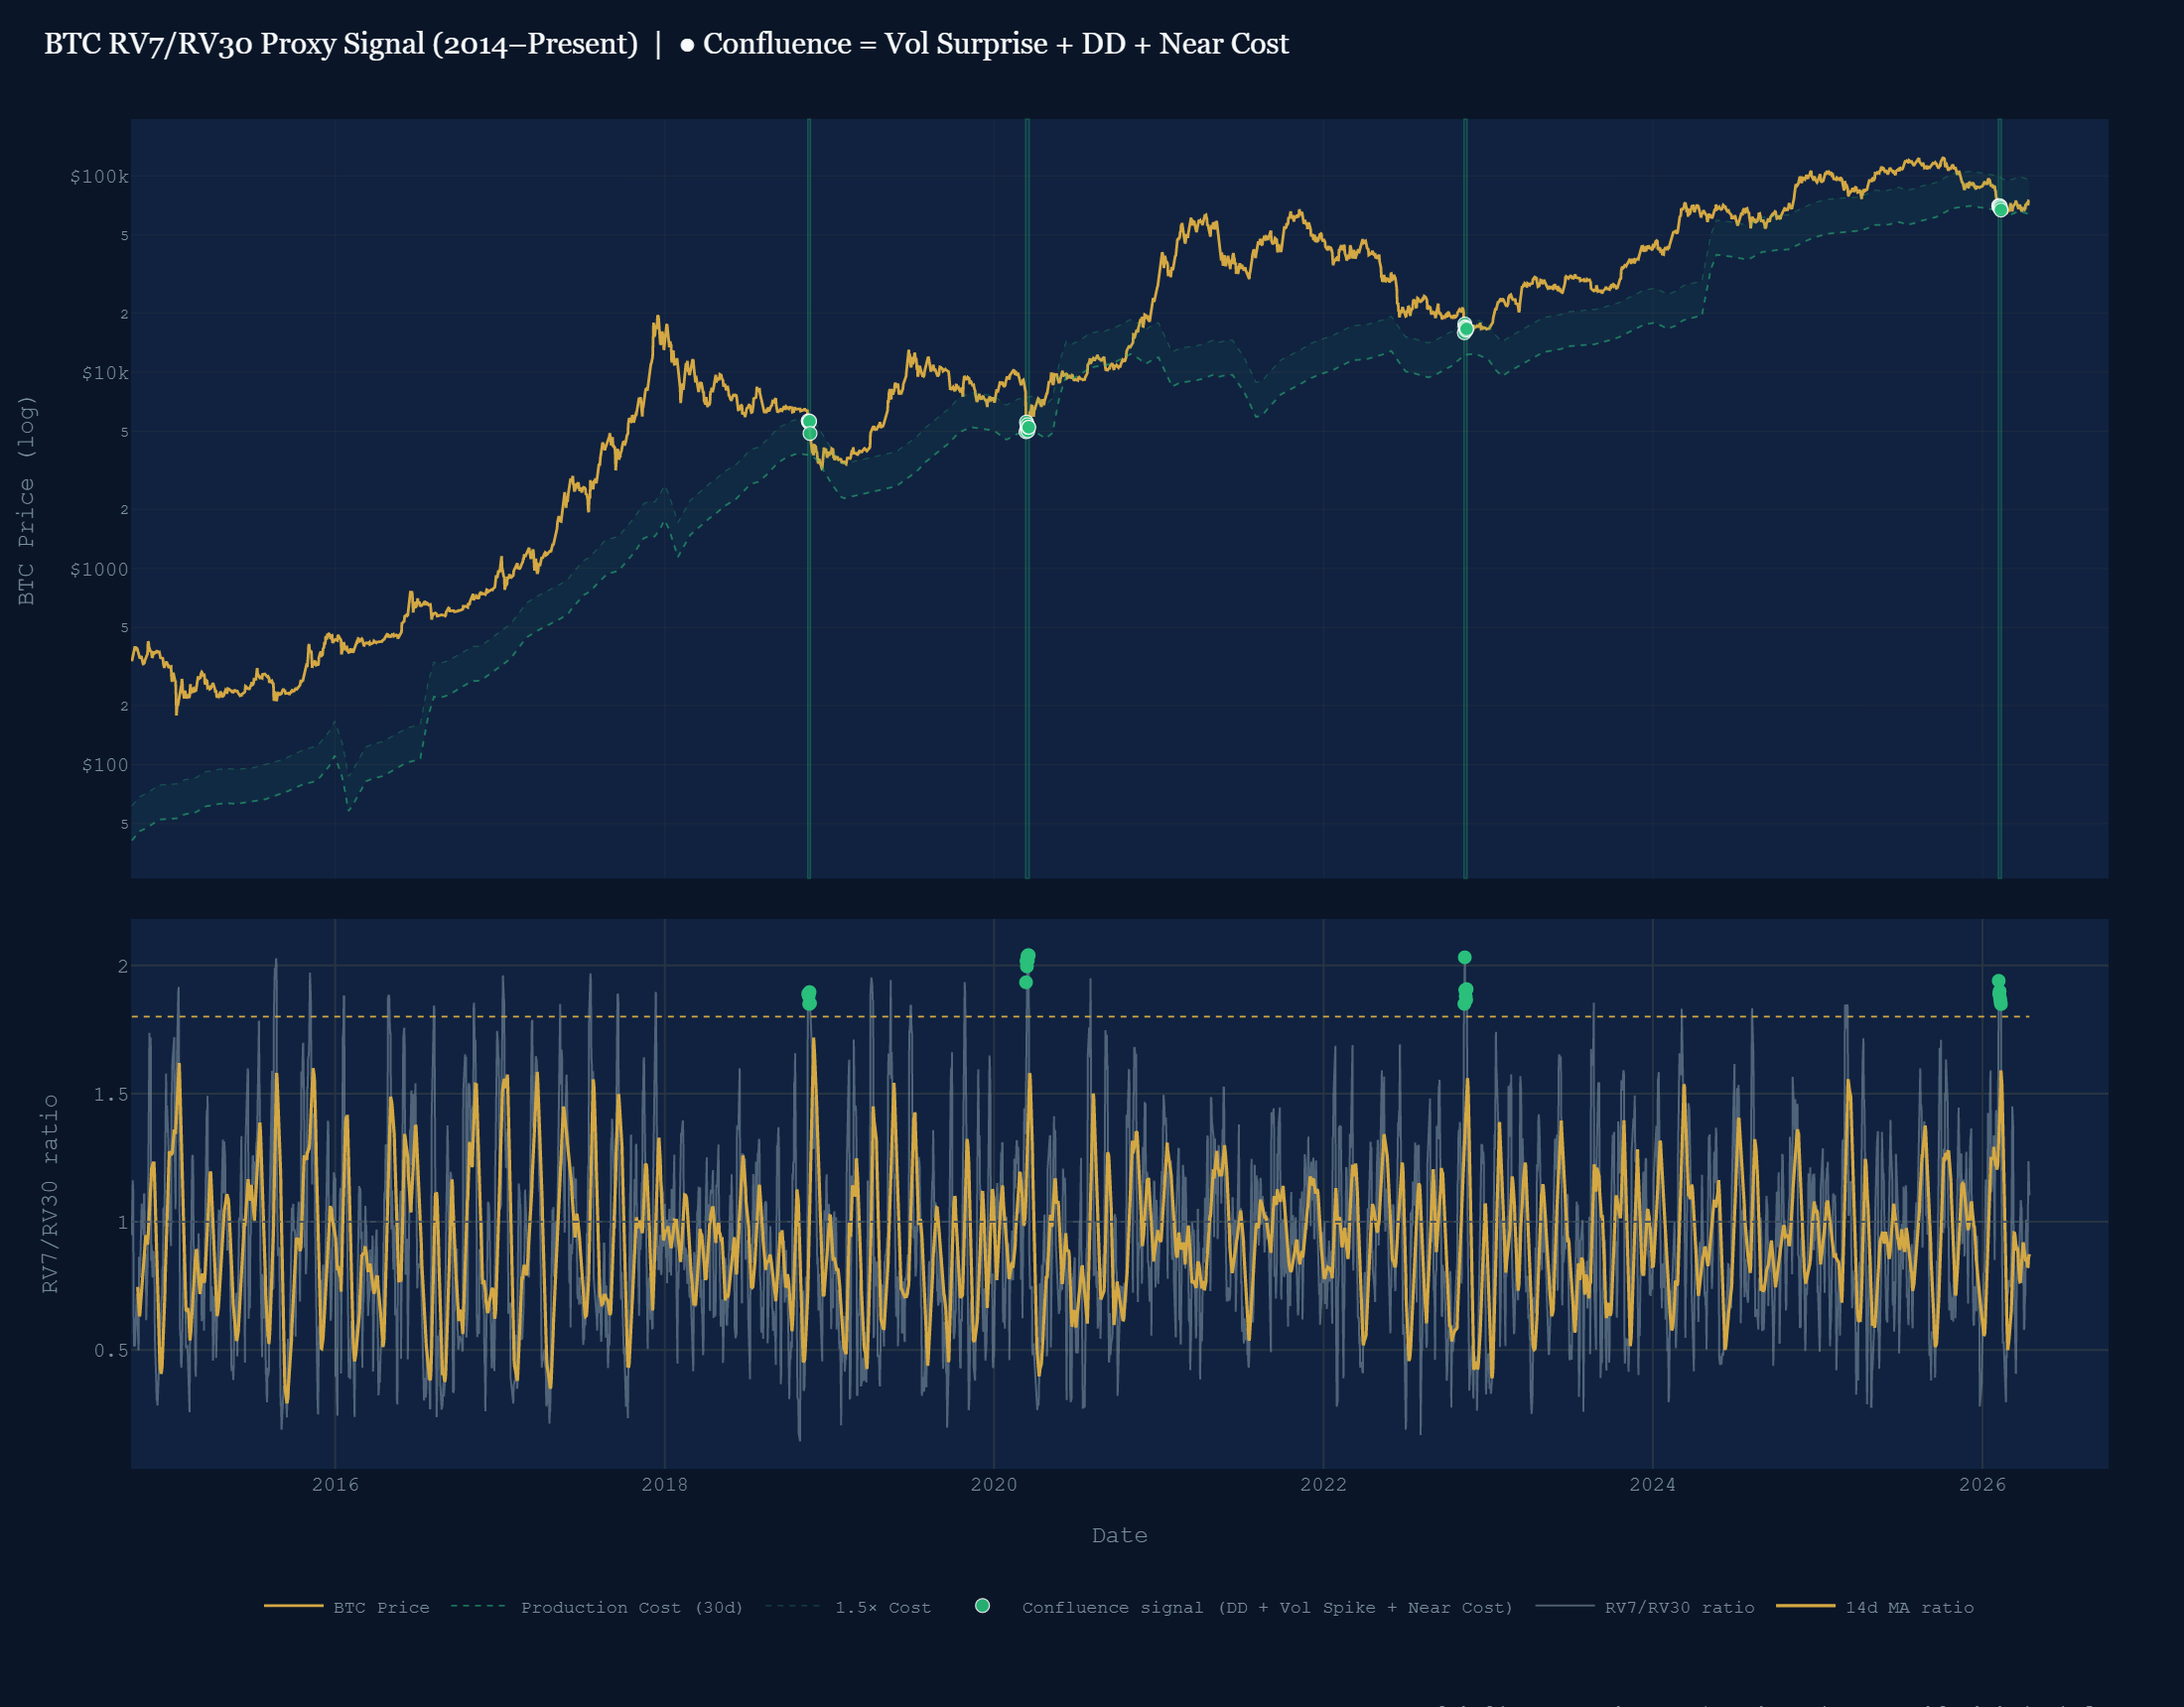
The three signals and their respective thresholds are: (1) BTC price trading at or below 1.5× the estimated miner breakeven production cost; (2) the RV7/RV30 realized volatility ratio exceeding 1.8×, indicating a sudden short-term volatility shock; and (3) a rolling 90-day price drawdown of at least 20% from the recent high. When all three conditions align simultaneously, the signal has fired on only a small number of occasions since 2014 — and each instance has corresponded to a region that, in hindsight, represented a major long-term buying opportunity. Most recently, in February 2026, all three signals were active concurrently for the first time in this market cycle.
Why Combine Signals?
Bear market bottoms in Bitcoin are not gentle inflection points. They arrive with the combined weight of miner financial stress, leveraged capitulation, and the exhaustion of sellers — all of which manifest in observable, quantifiable data. Using a confluence of independent signals rather than relying on any one metric reduces the probability of false positives and provides higher-confidence entries.
The three signals are deliberately drawn from different data sources and economic mechanisms: the production cost comes from mining network fundamentals; the volatility ratio comes from price action alone; and the drawdown metric is a simple momentum measure. When all three agree, the market is simultaneously: economically distressed at the miner level, experiencing a sudden volatility shock, and off materially from recent highs. That intersection of conditions has been rare — and historically rewarding for patient, long-term oriented investors.
Signal 1: Miner Production Cost (Most Important)
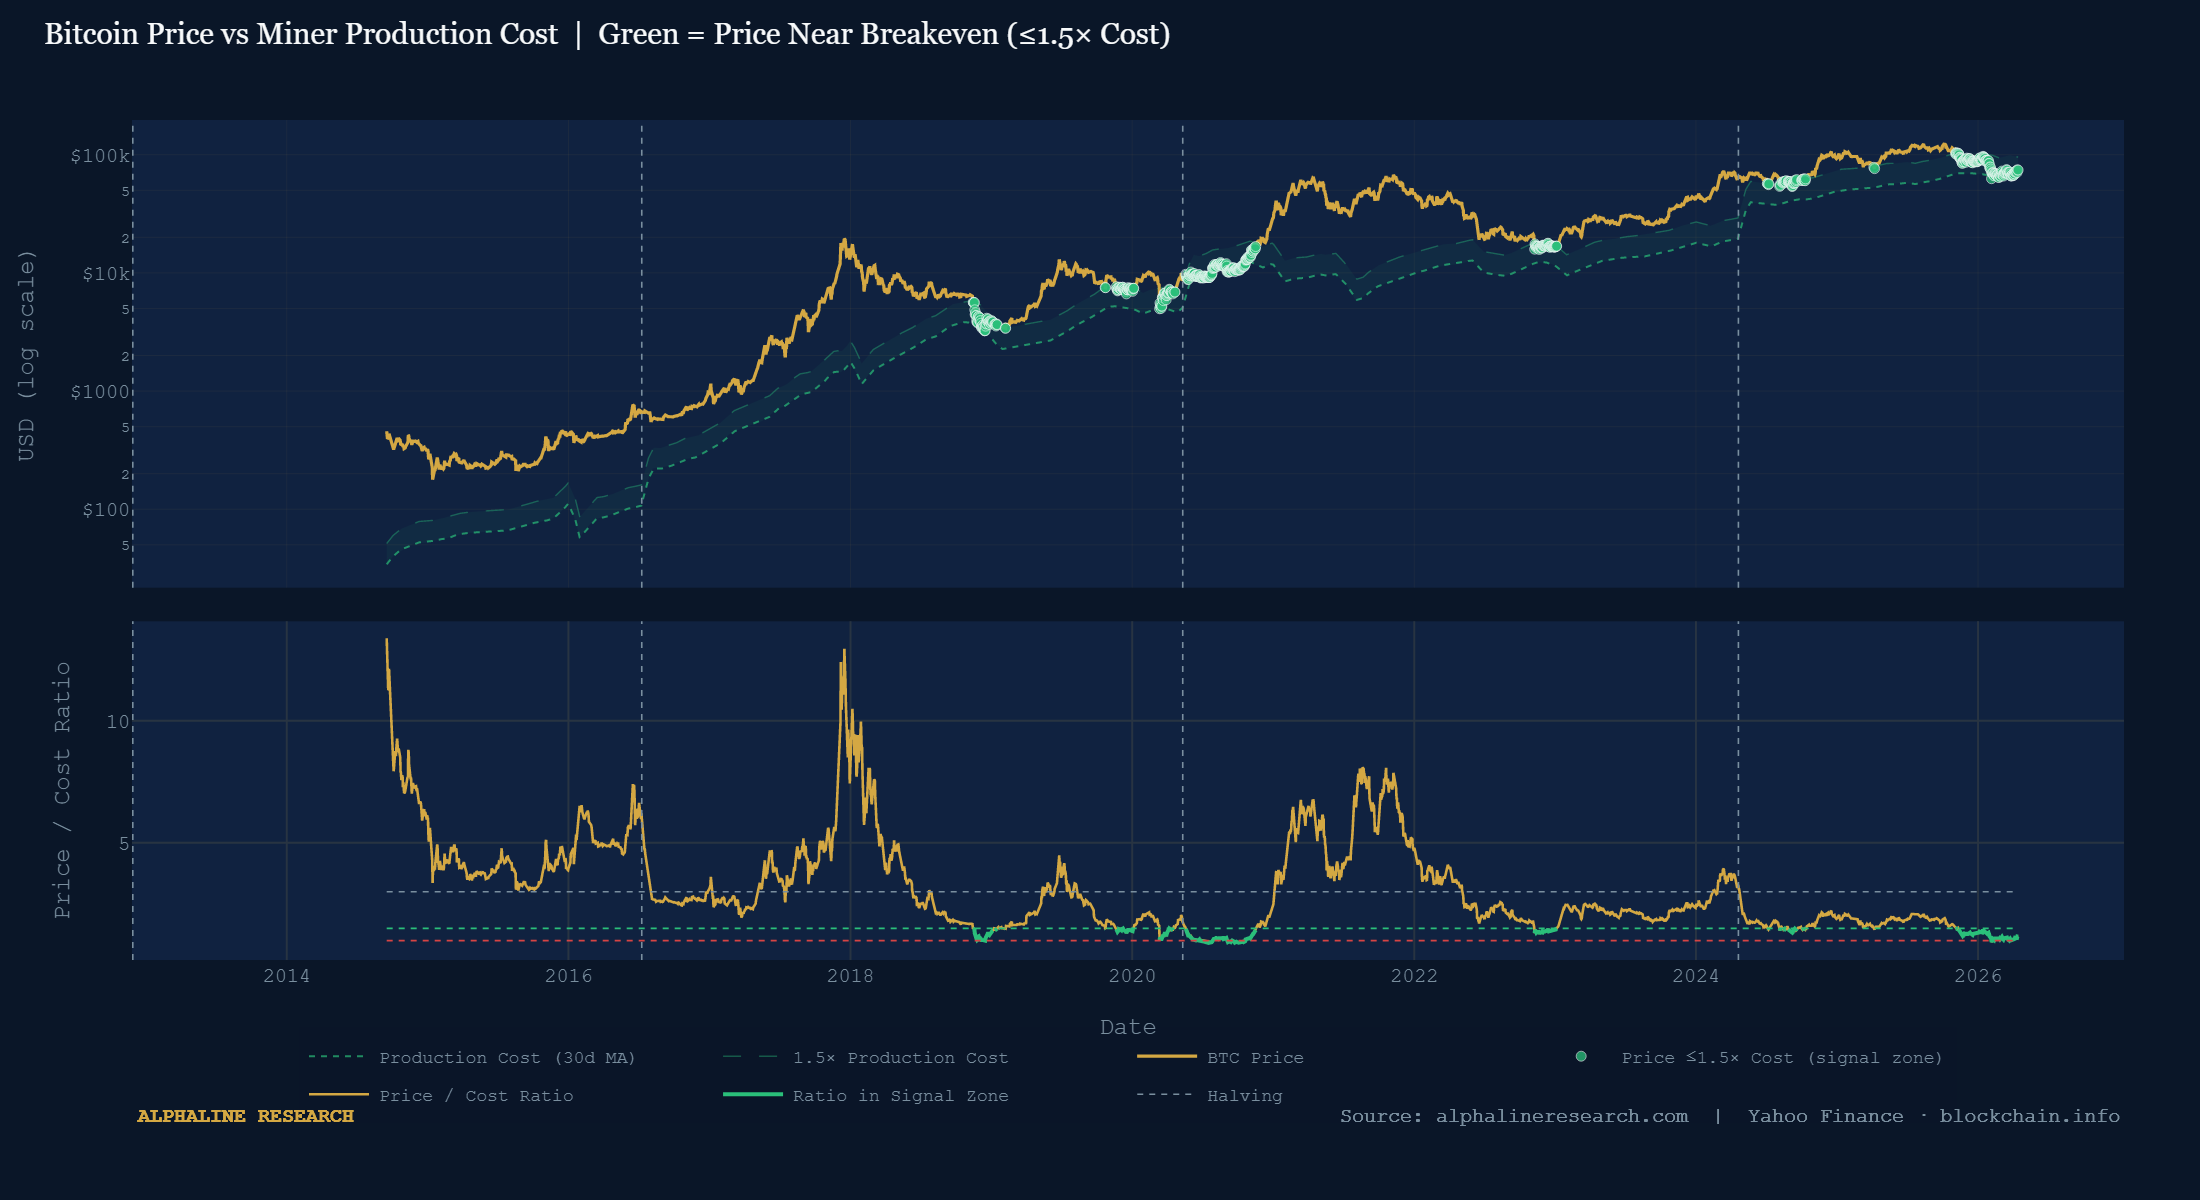
Of the three signals, the production cost is the most economically grounded anchor. Bitcoin mining is an industrial activity with real input costs — primarily electricity — and those costs set a floor below which miners cannot indefinitely operate without shutting down hardware. When the market price of Bitcoin approaches that breakeven level, it represents genuine economic distress in the mining ecosystem: a signal that the weakest, highest-cost miners are being forced out, and that the remaining market participants are pricing Bitcoin near what it costs to produce.
Historically, the production cost has expanded steadily across cycles, driven by growth in global hash rate and periodically compressed by halvings that reduce block rewards. This long-run upward drift means the production cost acts as a rising support level — one that is structurally linked to the commitment of real capital to the network.
Model Construction & Assumptions
The production cost is estimated using the following assumptions and applied daily using blockchain.info mining difficulty data. The hash rate is derived from the network difficulty, and the BTC mined daily is 144 blocks × the prevailing block reward. The result is smoothed using a 30-day rolling mean to remove difficulty-adjustment noise.
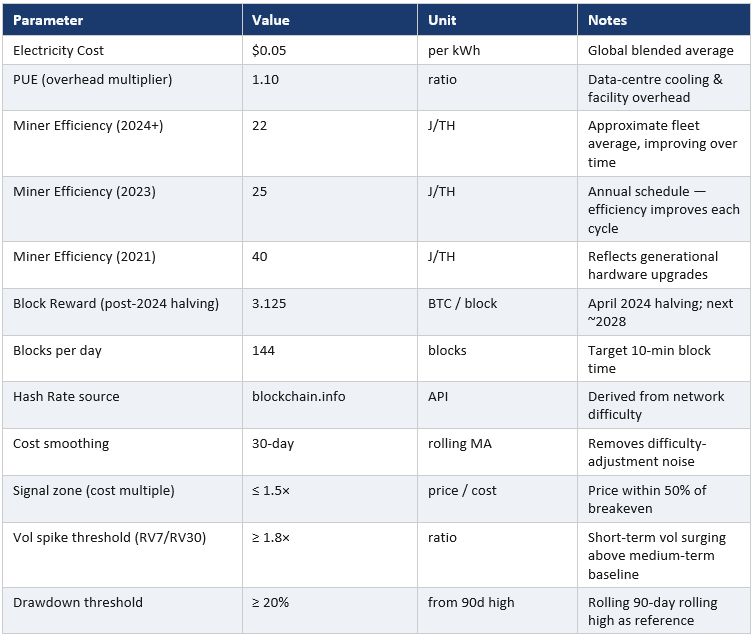
The signal zone is defined as a price-to-cost multiple of 1.5× or below: the BTC price must be within 50% of the estimated breakeven for the signal to be active. The band in the chart below represents the production cost itself (lower bound) and 1.5× that cost (upper bound).
The Role of Hash Rate Growth
The production cost does not stay static. It rises over time as the global hash rate grows, and rises further following halvings, which cut the block reward and thus the BTC earned per unit of computational work.
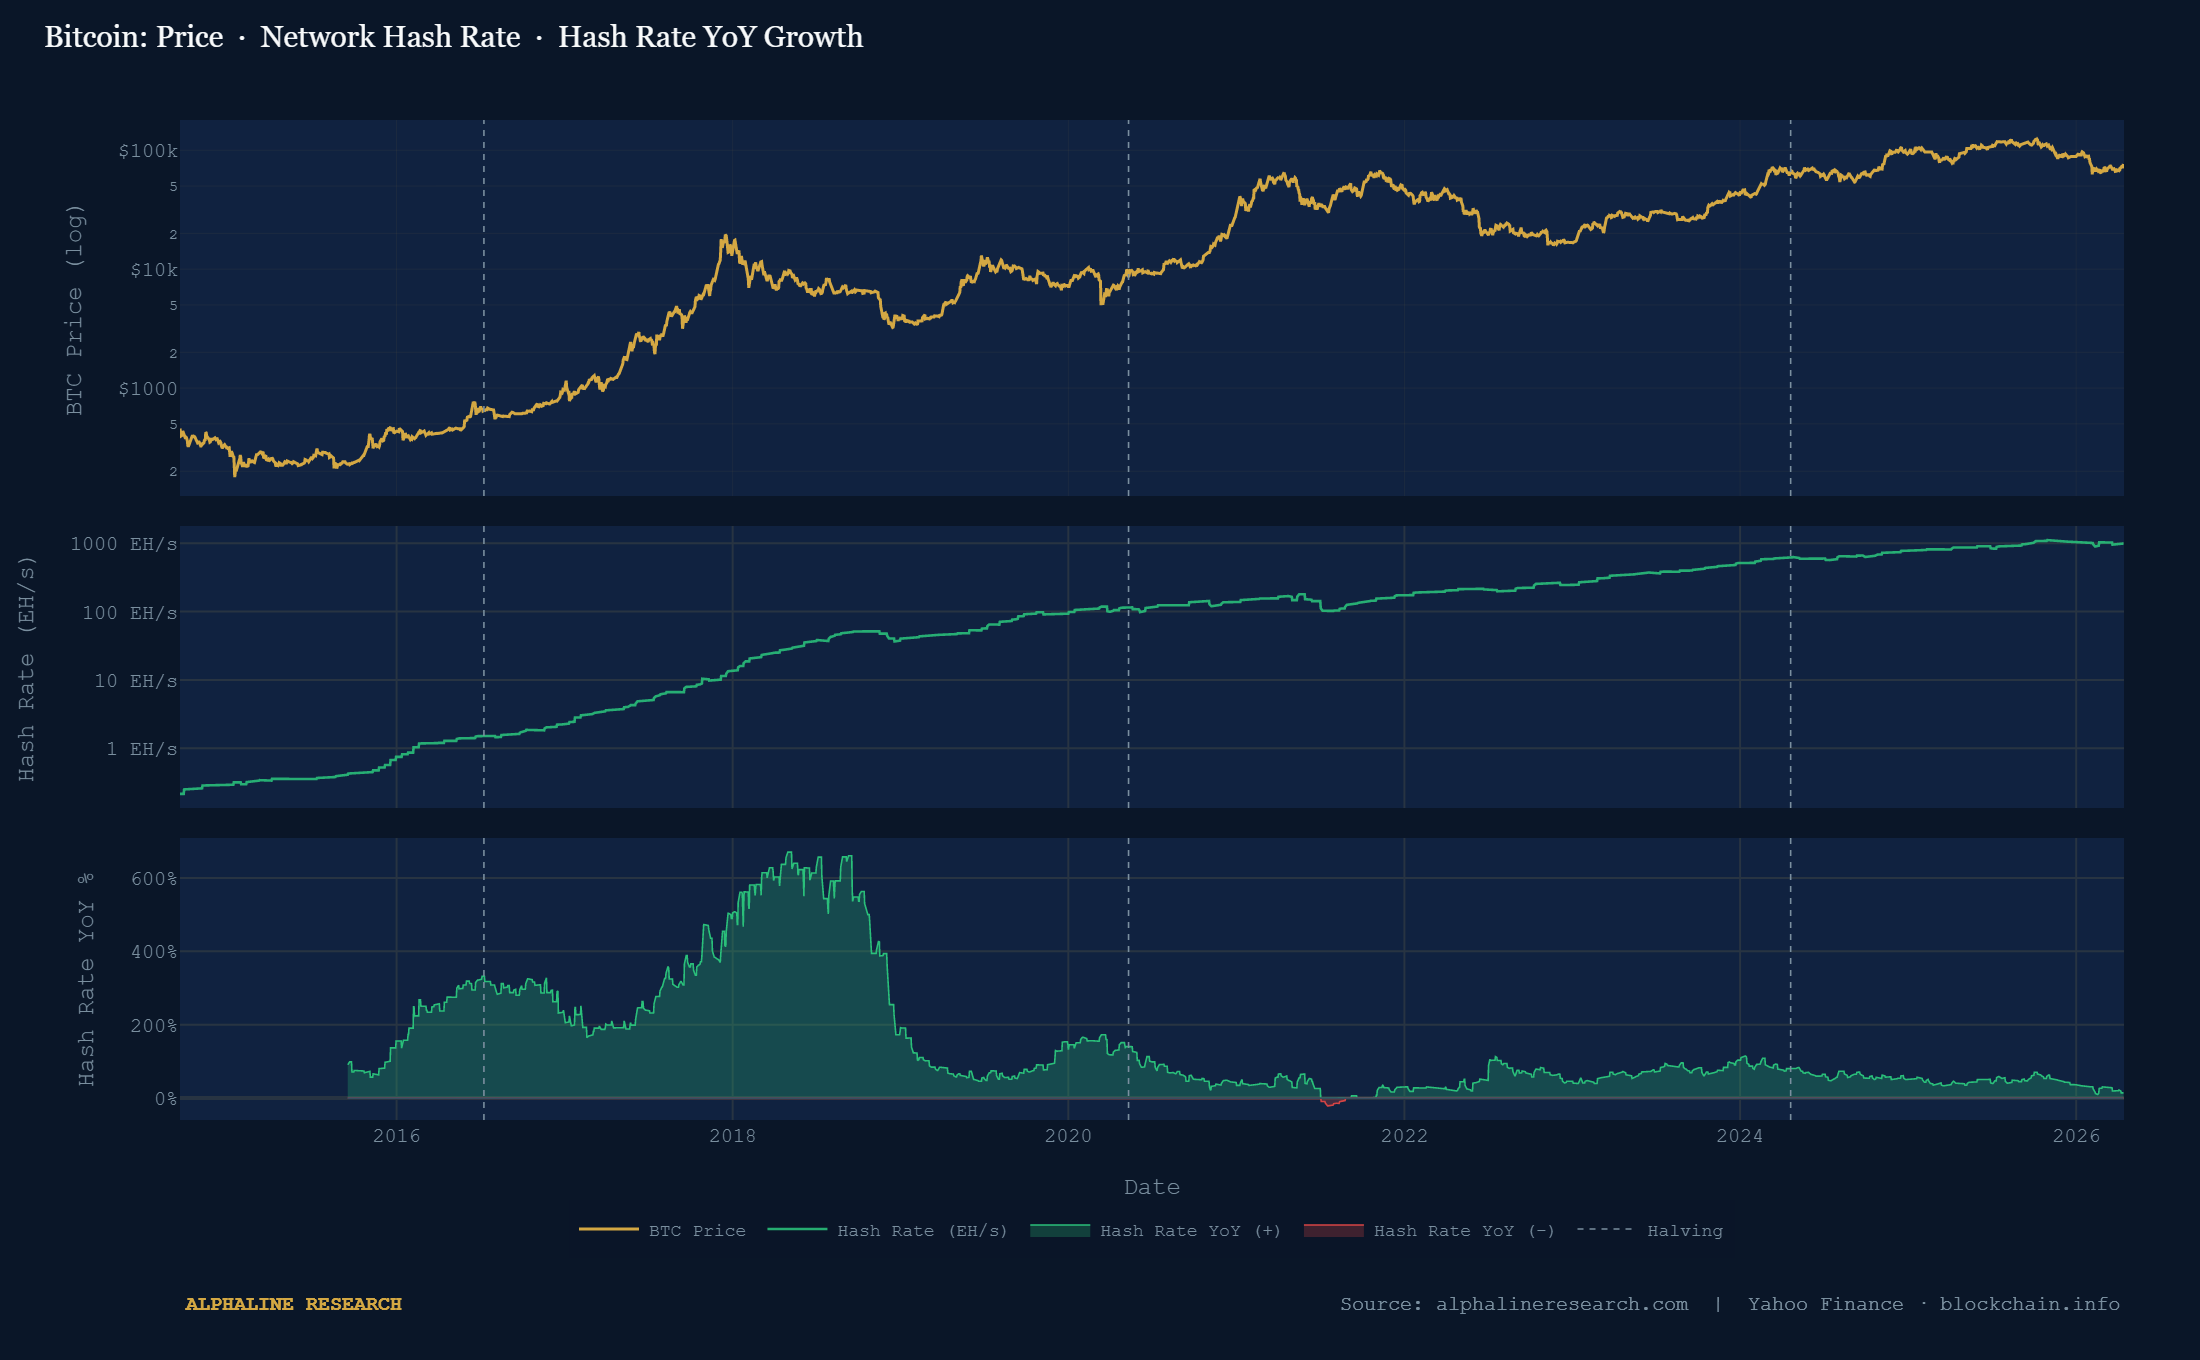
As shown in the chart below, the global hash rate has grown from fractions of an EH/s in 2014 to over 1,000 EH/s today — a compounded expansion that has persisted through every bear market. Even during the most severe drawdowns (2018, 2020, 2022), the hash rate experienced only temporary, shallow declines before resuming its structural upward trend. The one notable exception was the China mining ban in mid-2021, which caused a sharp but short-lived decline; hash rate recovered to new highs within months.
The YoY growth rate in hash rate has naturally decelerated from the triple-digit percentages of early cycles as the base grows larger. More recently, the growth rate has moderated to the 20–50% range on an annual basis. This moderation does not undermine the thesis — it is expected as the network matures — but it does mean the production cost rises at a slower pace than it once did.
Signal 2: RV7/RV30 Volatility Spike (Second Most Important)
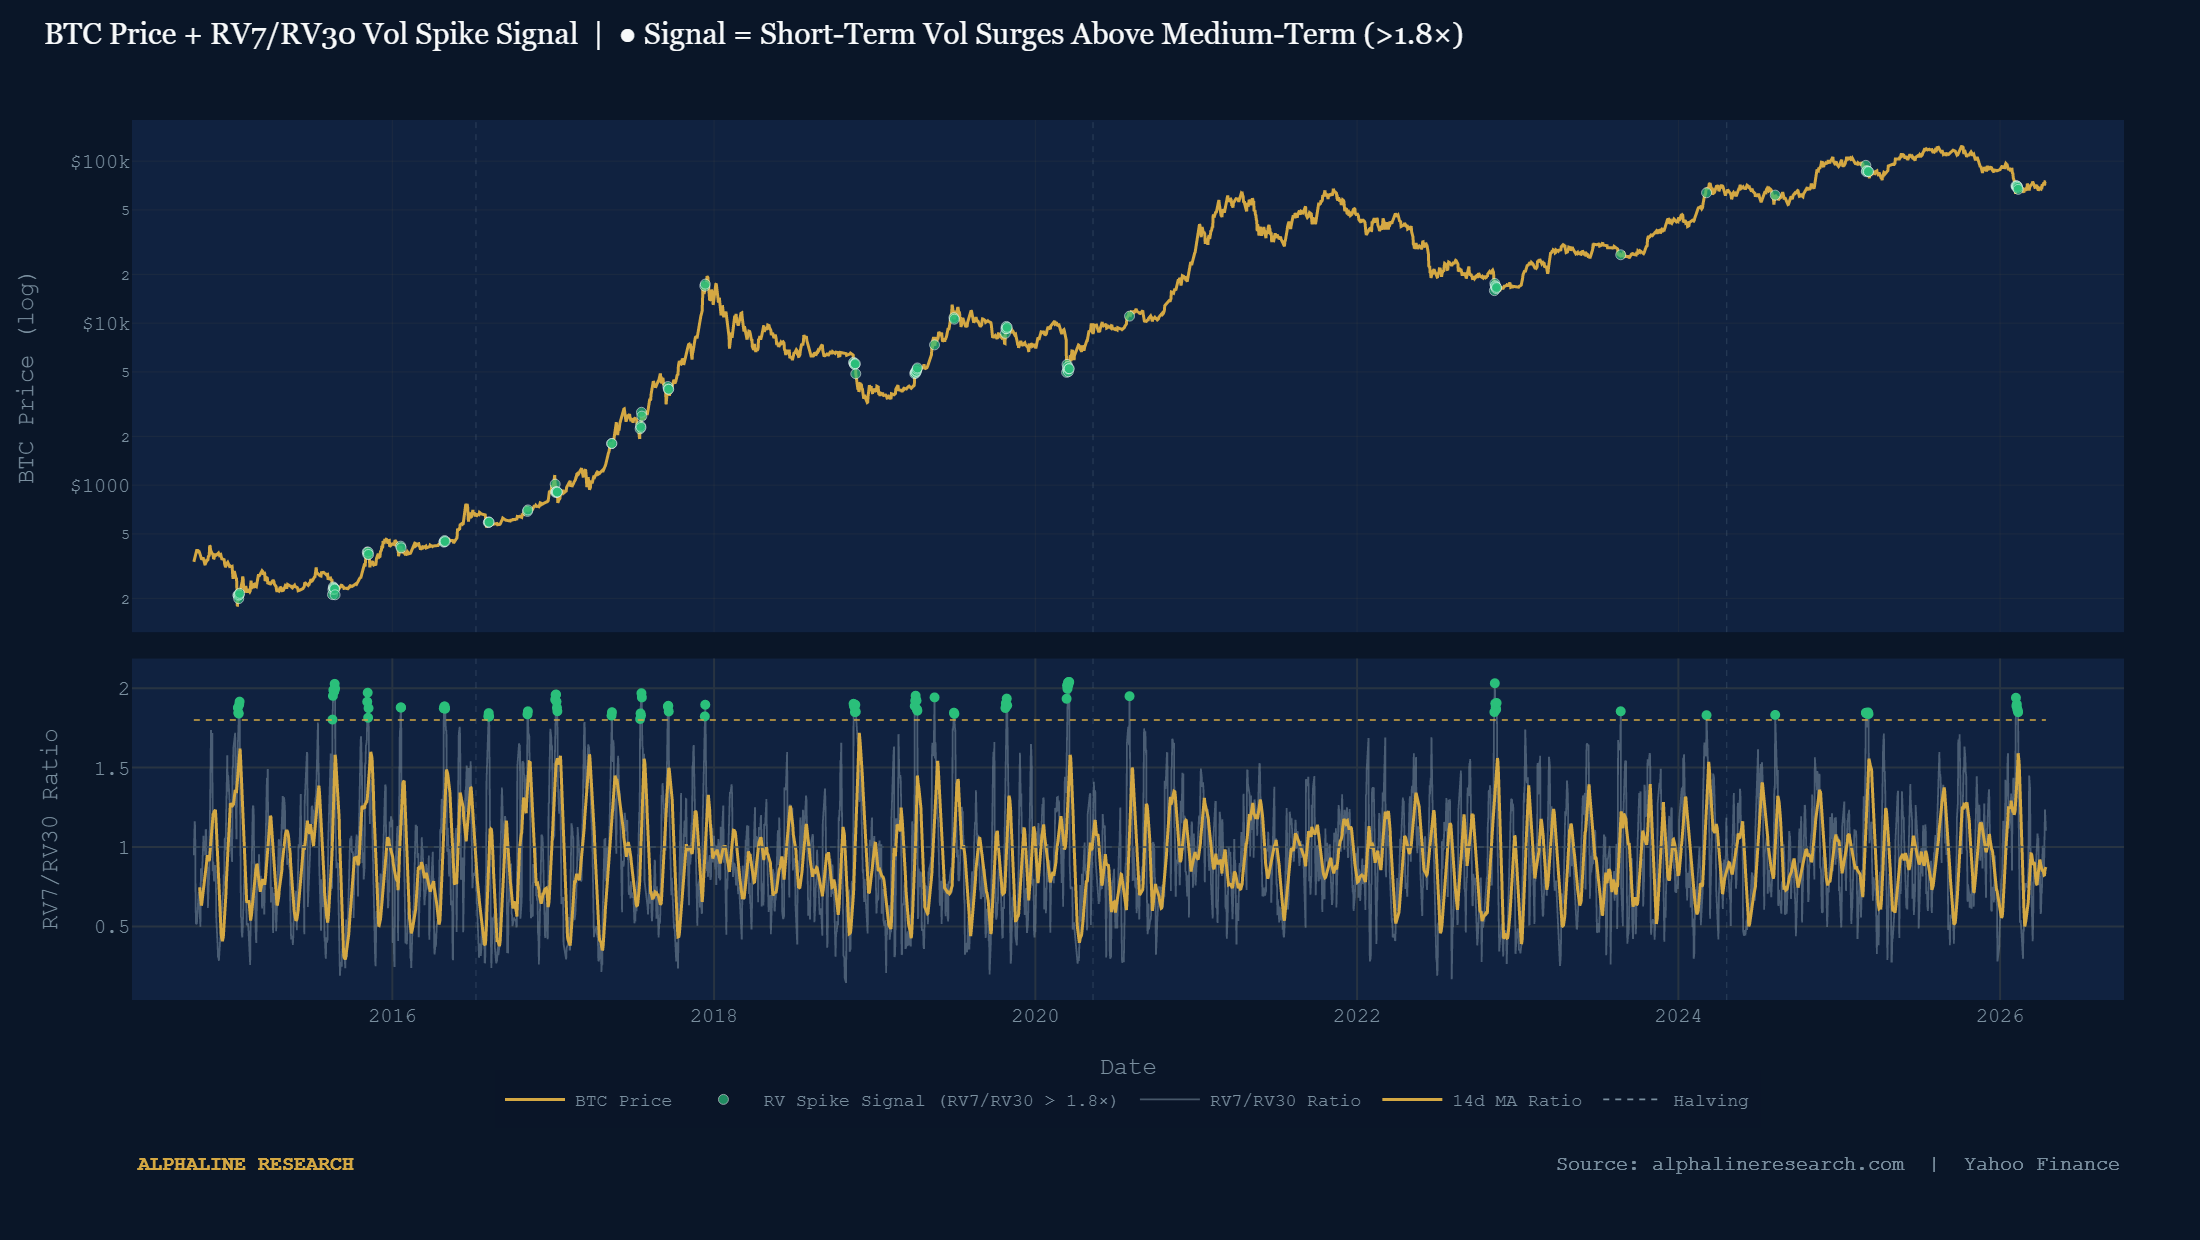
The second signal is a realized volatility ratio: specifically, the ratio of 7-day annualised realized volatility to 30-day annualised realized volatility, or RV7/RV30. Both series are computed as the rolling standard deviation of daily log returns, annualised by multiplying by √365 and expressed as a percentage.
RV7 measures the intensity of price moves over the past week. RV30 measures the prevailing volatility regime over the past month. The ratio therefore tells us how aggressively the short-term vol has deviated from its own medium-term baseline. A ratio near 1.0 indicates that the market is moving at its normal pace. A ratio above 1.5 suggests an elevated short-term shock. A ratio at or above 1.8× — our signal threshold — indicates that 7-day realized vol is nearly double its 30-day baseline, which has historically coincided with sharp capitulation events, sudden macro dislocations, or forced liquidation cascades.
The signal fires frequently as a standalone indicator — volatility spikes are common in crypto markets — which is precisely why it must be used in conjunction with the other two conditions. On its own, an RV7/RV30 ratio above 1.8× fires across bull and bear markets alike. It is only when combined with proximity to production cost and a meaningful price drawdown that the signal becomes meaningful as a potential bottoming indicator.
Signal 3: 90-Day Rolling Drawdown (Third, Noisiest)
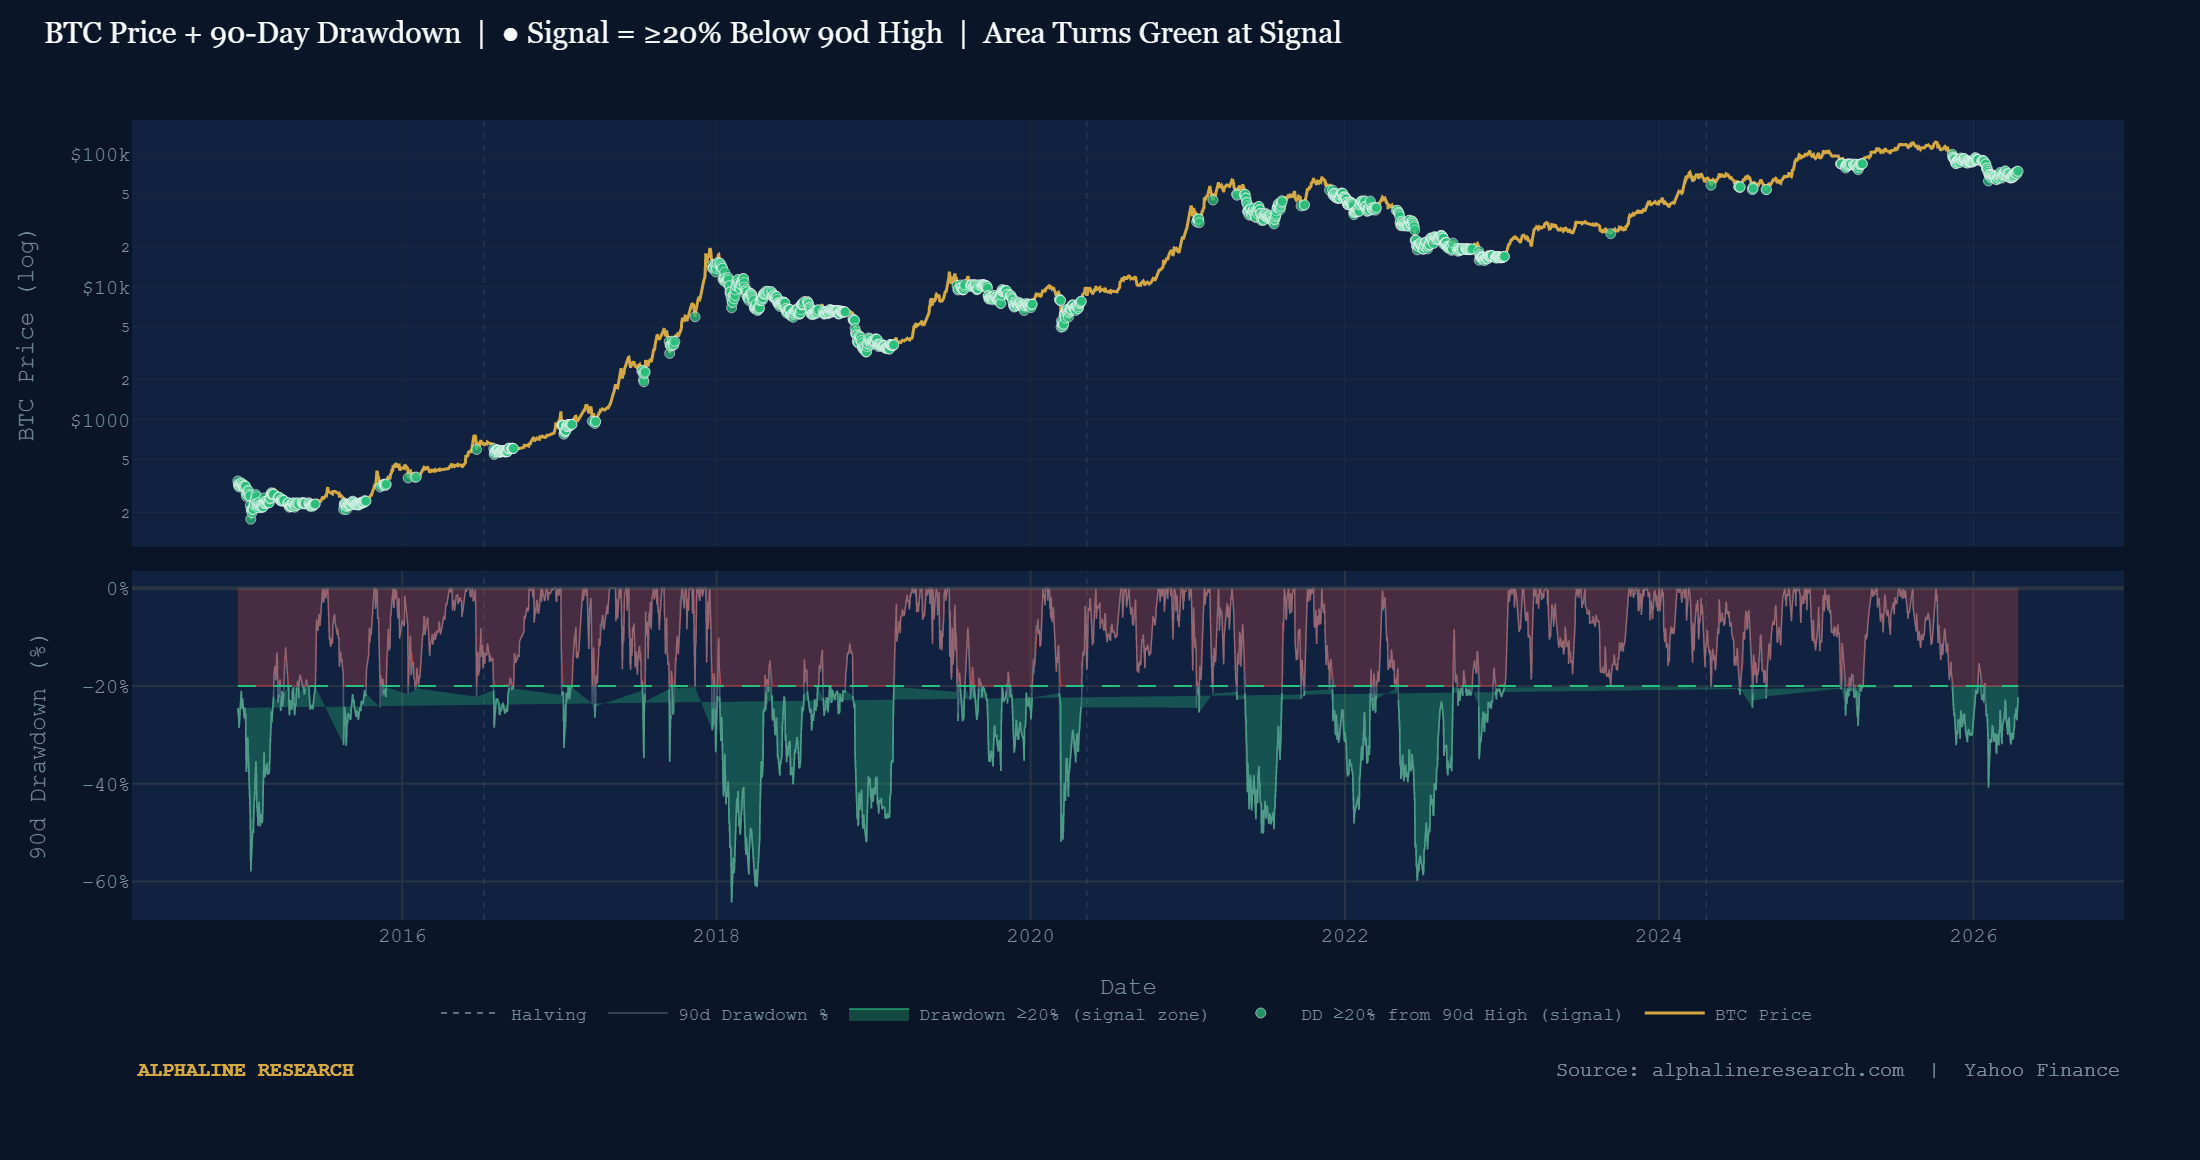
The third and noisiest of the three signals is a simple drawdown measure: the percentage decline from the rolling 90-day high. The signal threshold is a drawdown of 20% or more from the 90-day peak. This condition effectively helps to confirm that price has undergone a meaningful correction in the recent past, ruling out cases where the vol spike or production cost proximity occurs during sideways consolidation or near all-time highs.
Bitcoin is a demonstrably mean-reverting asset over medium- to long-term horizons. Across every market cycle, periods of deep drawdown — where prices have fallen sharply from recent highs — have historically been followed by recoveries, provided the underlying network fundamentals (hash rate growth, adoption metrics, halving dynamics) remained intact. The 90-day drawdown condition is our way of formally including that reversion potential in the signal: we want to capture periods where price is not merely near its cost floor on an absolute basis, but has also sold off materially from recent levels.
The chart below illustrates how frequently the 20% threshold is breached across the full price history — it is not a rare event on its own. The signal zone turns green in the lower pane whenever the drawdown exceeds the threshold, and green dots on the price chart mark the corresponding days.
The Confluence: When All Three Align
The power of this framework lies not in any individual indicator but in their simultaneous activation. When all three conditions are met — price near or below 1.5× production cost, RV7/RV30 above 1.8×, and a 90-day drawdown of at least 20% — the market is communicating several things at once:
- Miners are operating under genuine economic pressure, and some portion of the global hash rate is no longer profitable at current prices.
- A sudden, sharp volatility shock has just occurred, indicative of forced selling, liquidation cascades, or acute macro fear — not merely a slow drift downward.
- The price has declined meaningfully from recent highs, ruling out proximity to production cost that occurs during bull market consolidations.
Since 2014, this triple confluence has fired a small number of times. The green dots that represent confluence signals cluster around what were historical major cycle lows: late 2018 (the bottom of the extended bear market following the 2017 peak), March 2020 (the COVID crash), late 2022 (the FTX-era capitulation), and most recently in February 2026 — the first confluence signal of the current cycle.
The sample size is intentionally small. This is not a trading signal that fires dozens of times per year — it fires rarely, by design, because all three conditions must align. That rarity is a feature: it reduces the probability of false positives and focuses attention on the episodes most likely to represent genuine, sustained bear market floors.
This signal is not perfect, and the price can continue lower after all three conditions are met. The signal does not tell investors when a recovery will begin. What the historical data does suggest is that periods of full confluence have represented strong long-term entry points for patient investors — typically over 18-month or longer time horizons — not necessarily short-term momentum trades.
Two key premises must hold for this framework to remain useful in future cycles. First, that the global hash rate continues its long-run growth trend, which keeps the production cost rising and relevant as an anchor. Second, that Bitcoin continues to exhibit mean-reverting behaviour over medium-term horizons — a property rooted in investor psychology, halving-driven supply dynamics, and the increasing depth of institutional participation.
Given these caveats, we view the February 2026 confluence signal as a meaningful data point — one that, in the context of prior cycles, has historically been associated with strong forward returns for investors with at least an 18-month time horizon. This model should be evaluated alongside a broader assessment of macro conditions, on-chain fundamentals, and individual risk tolerance.