In 2020, I built a model that priced ETH using daily transaction fees. The logic was clean: Ethereum is a settlement network, fees are the clearest signal of network demand, therefore fees should anchor price. The model had a high correlation — then EIP-4844 shipped in March 2024, fees dropped dramatically, and the model broke.
Fee revenue on Ethereum mainnet collapsed almost overnight. L2s — Arbitrum, Base, Optimism — had been quietly absorbing execution demand for years, and 4844 cut their costs to near zero. The fees that were supposed to reflect network demand mostly stopped flowing to mainnet. The discounted cash flow logic that had justified ETH's price since 2021 stopped working, and a lot of analysts who hadn't updated their frameworks spent the next year confused about why ETH kept underperforming.
I spent most of 2024 rebuilding. The question I kept coming back to: if fees aren't the right signal anymore, what is?
The answer, I think, is stablecoins.
Why stablecoins, not fees
Fees measure activity. Stablecoins measure commitment.
When a large institution moves $10 billion in USDC onto Ethereum, they are not making a speculative bet on ETH price. They are choosing Ethereum as infrastructure — as the settlement layer for real capital that needs to go somewhere on-chain. That capital has to live somewhere, and wherever it lives has a security requirement attached to it.
Ethereum's security comes from staked ETH. An attacker who wanted to compromise the network would need to acquire roughly a third of all staked ETH — currently a meaningful but finite sum. The lower ETH's market cap goes, the cheaper that attack becomes. The more stablecoins sit on the network, the more valuable the target gets.
There's a ratio that matters: stablecoins secured on Ethereum divided by ETH's market cap. When that ratio gets too high, the network is effectively under-collateralizing the value it's protecting. Large institutional holders of on-chain stablecoins — whether they have run this math explicitly or not — have a direct financial interest in that ratio staying sane. Their incentive structure supports ETH's price floor, whether they think of it that way or not.
That's the thesis. Not fee capture. Not ultrasound money. Settlement infrastructure economics.
What $164 billion actually looks like
Most people know Ethereum holds the majority of global stablecoin supply. Fewer have looked at the actual numbers recently.
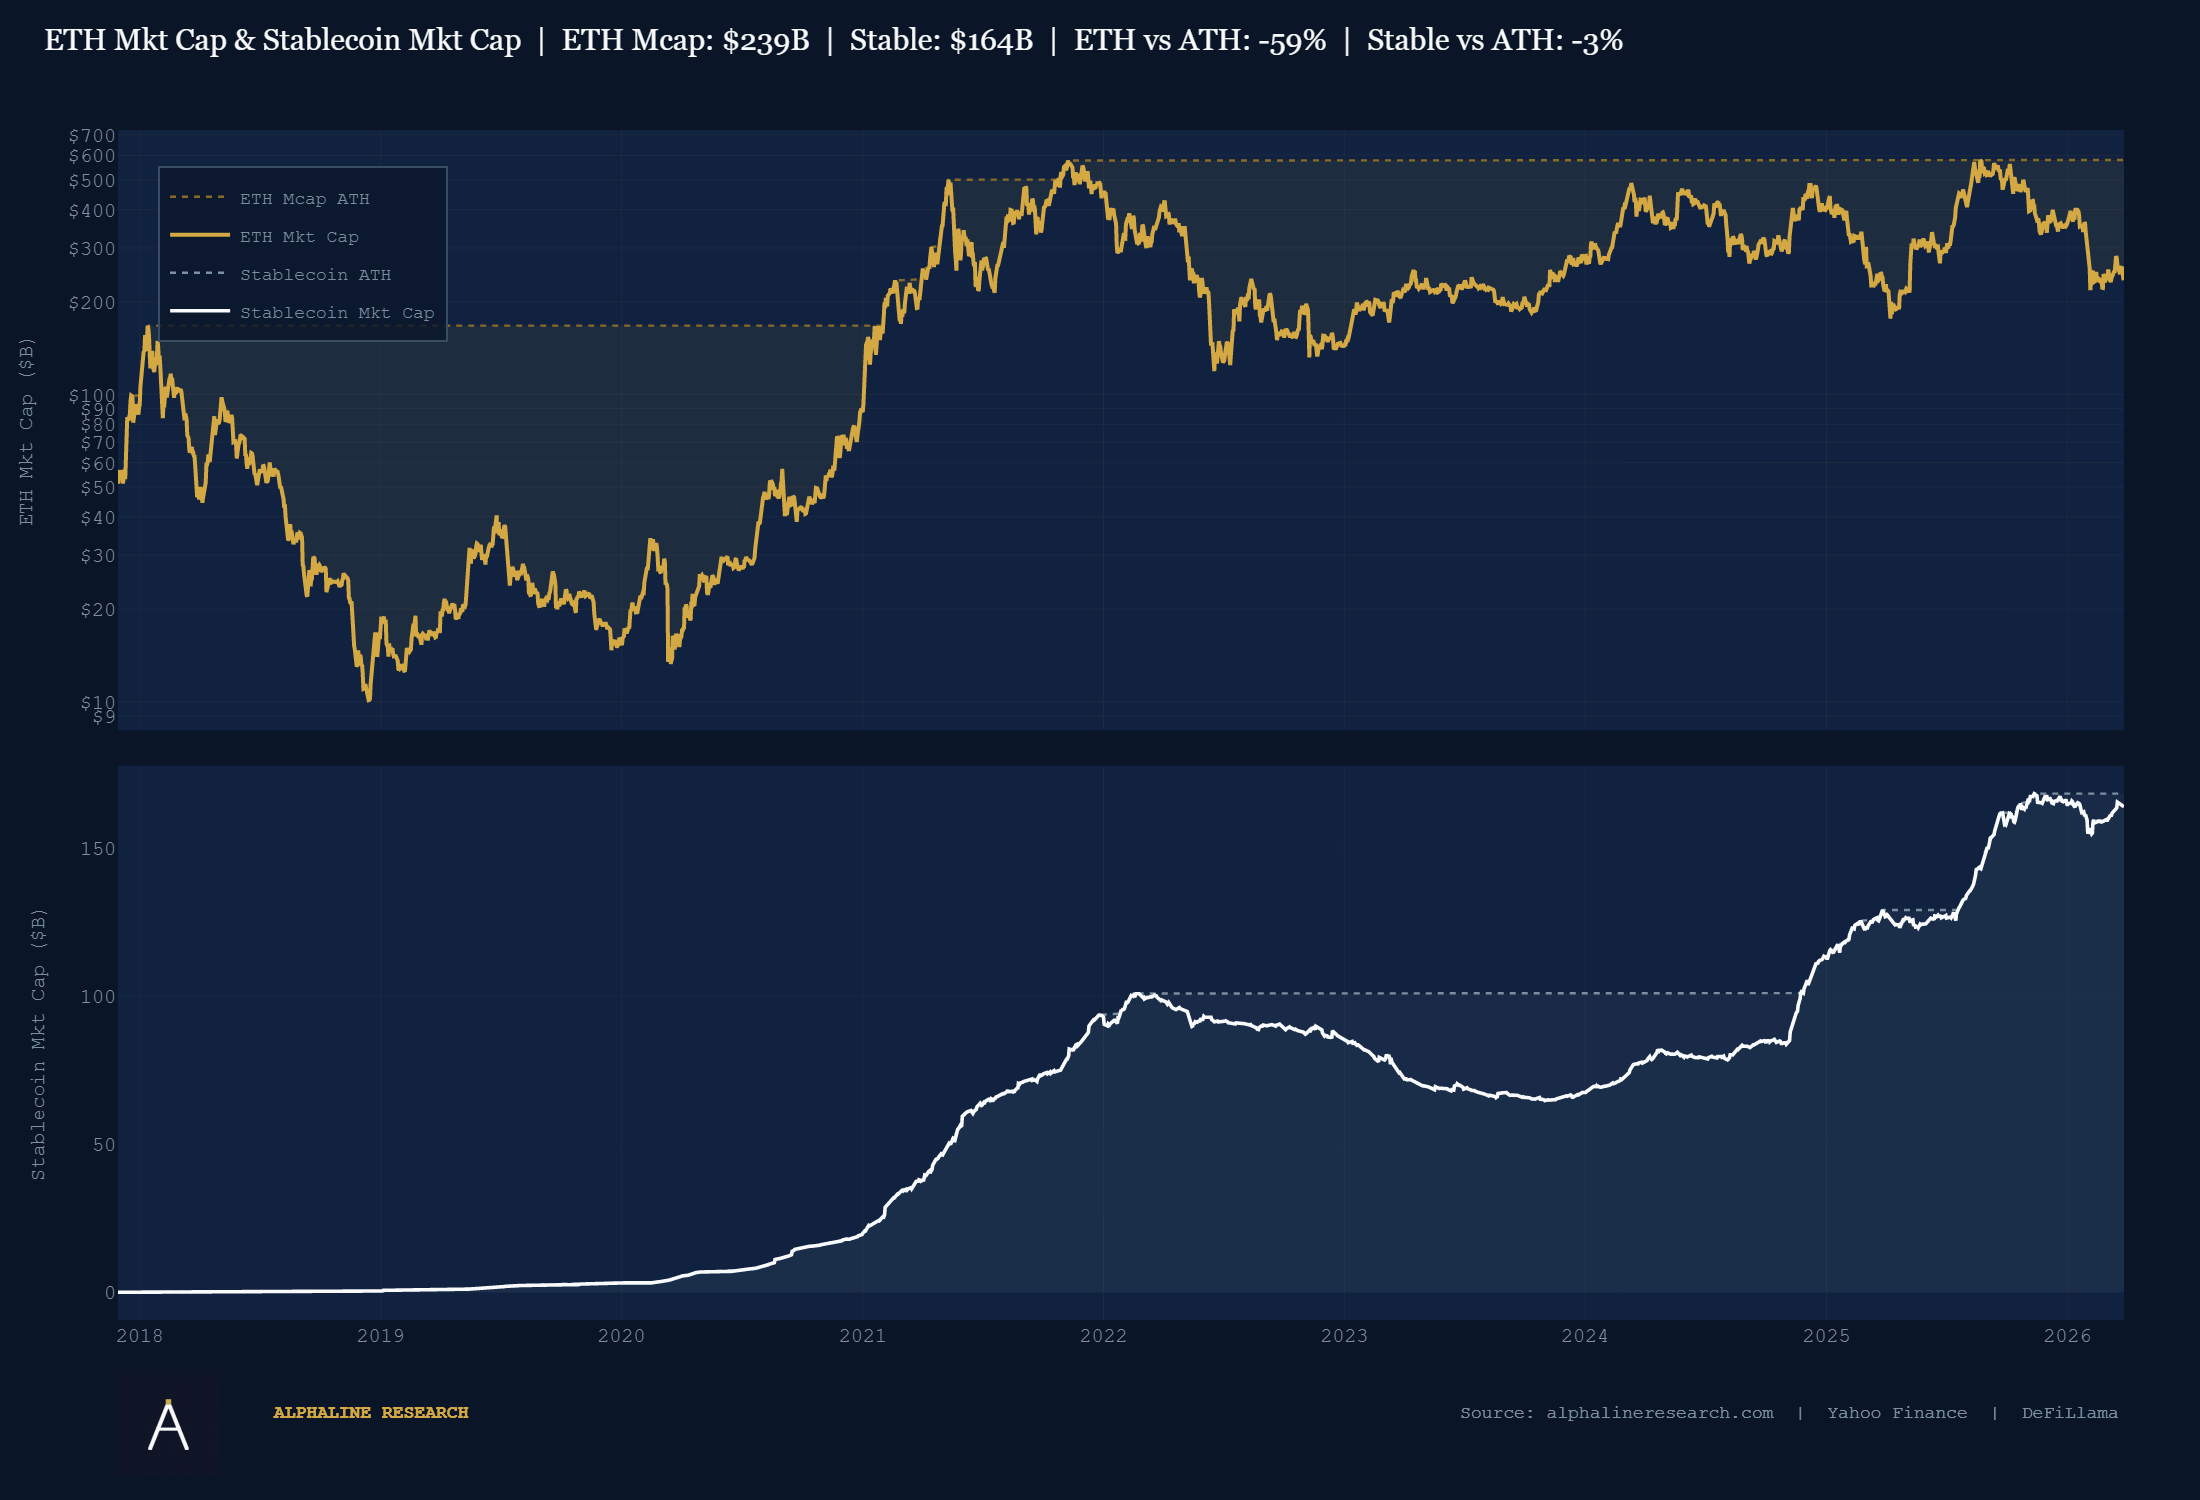
Stablecoins on Ethereum: $164 billion, within 3% of an all-time high. ETH's market cap: $239 billion, down 59% from its peak. Those two lines have never diverged this much.
The 2022 bear market did take a chunk out of stablecoin supply — LUNA collapsed, BUSD got wound down by regulators, DAI lost ground. But look at what replaced them.
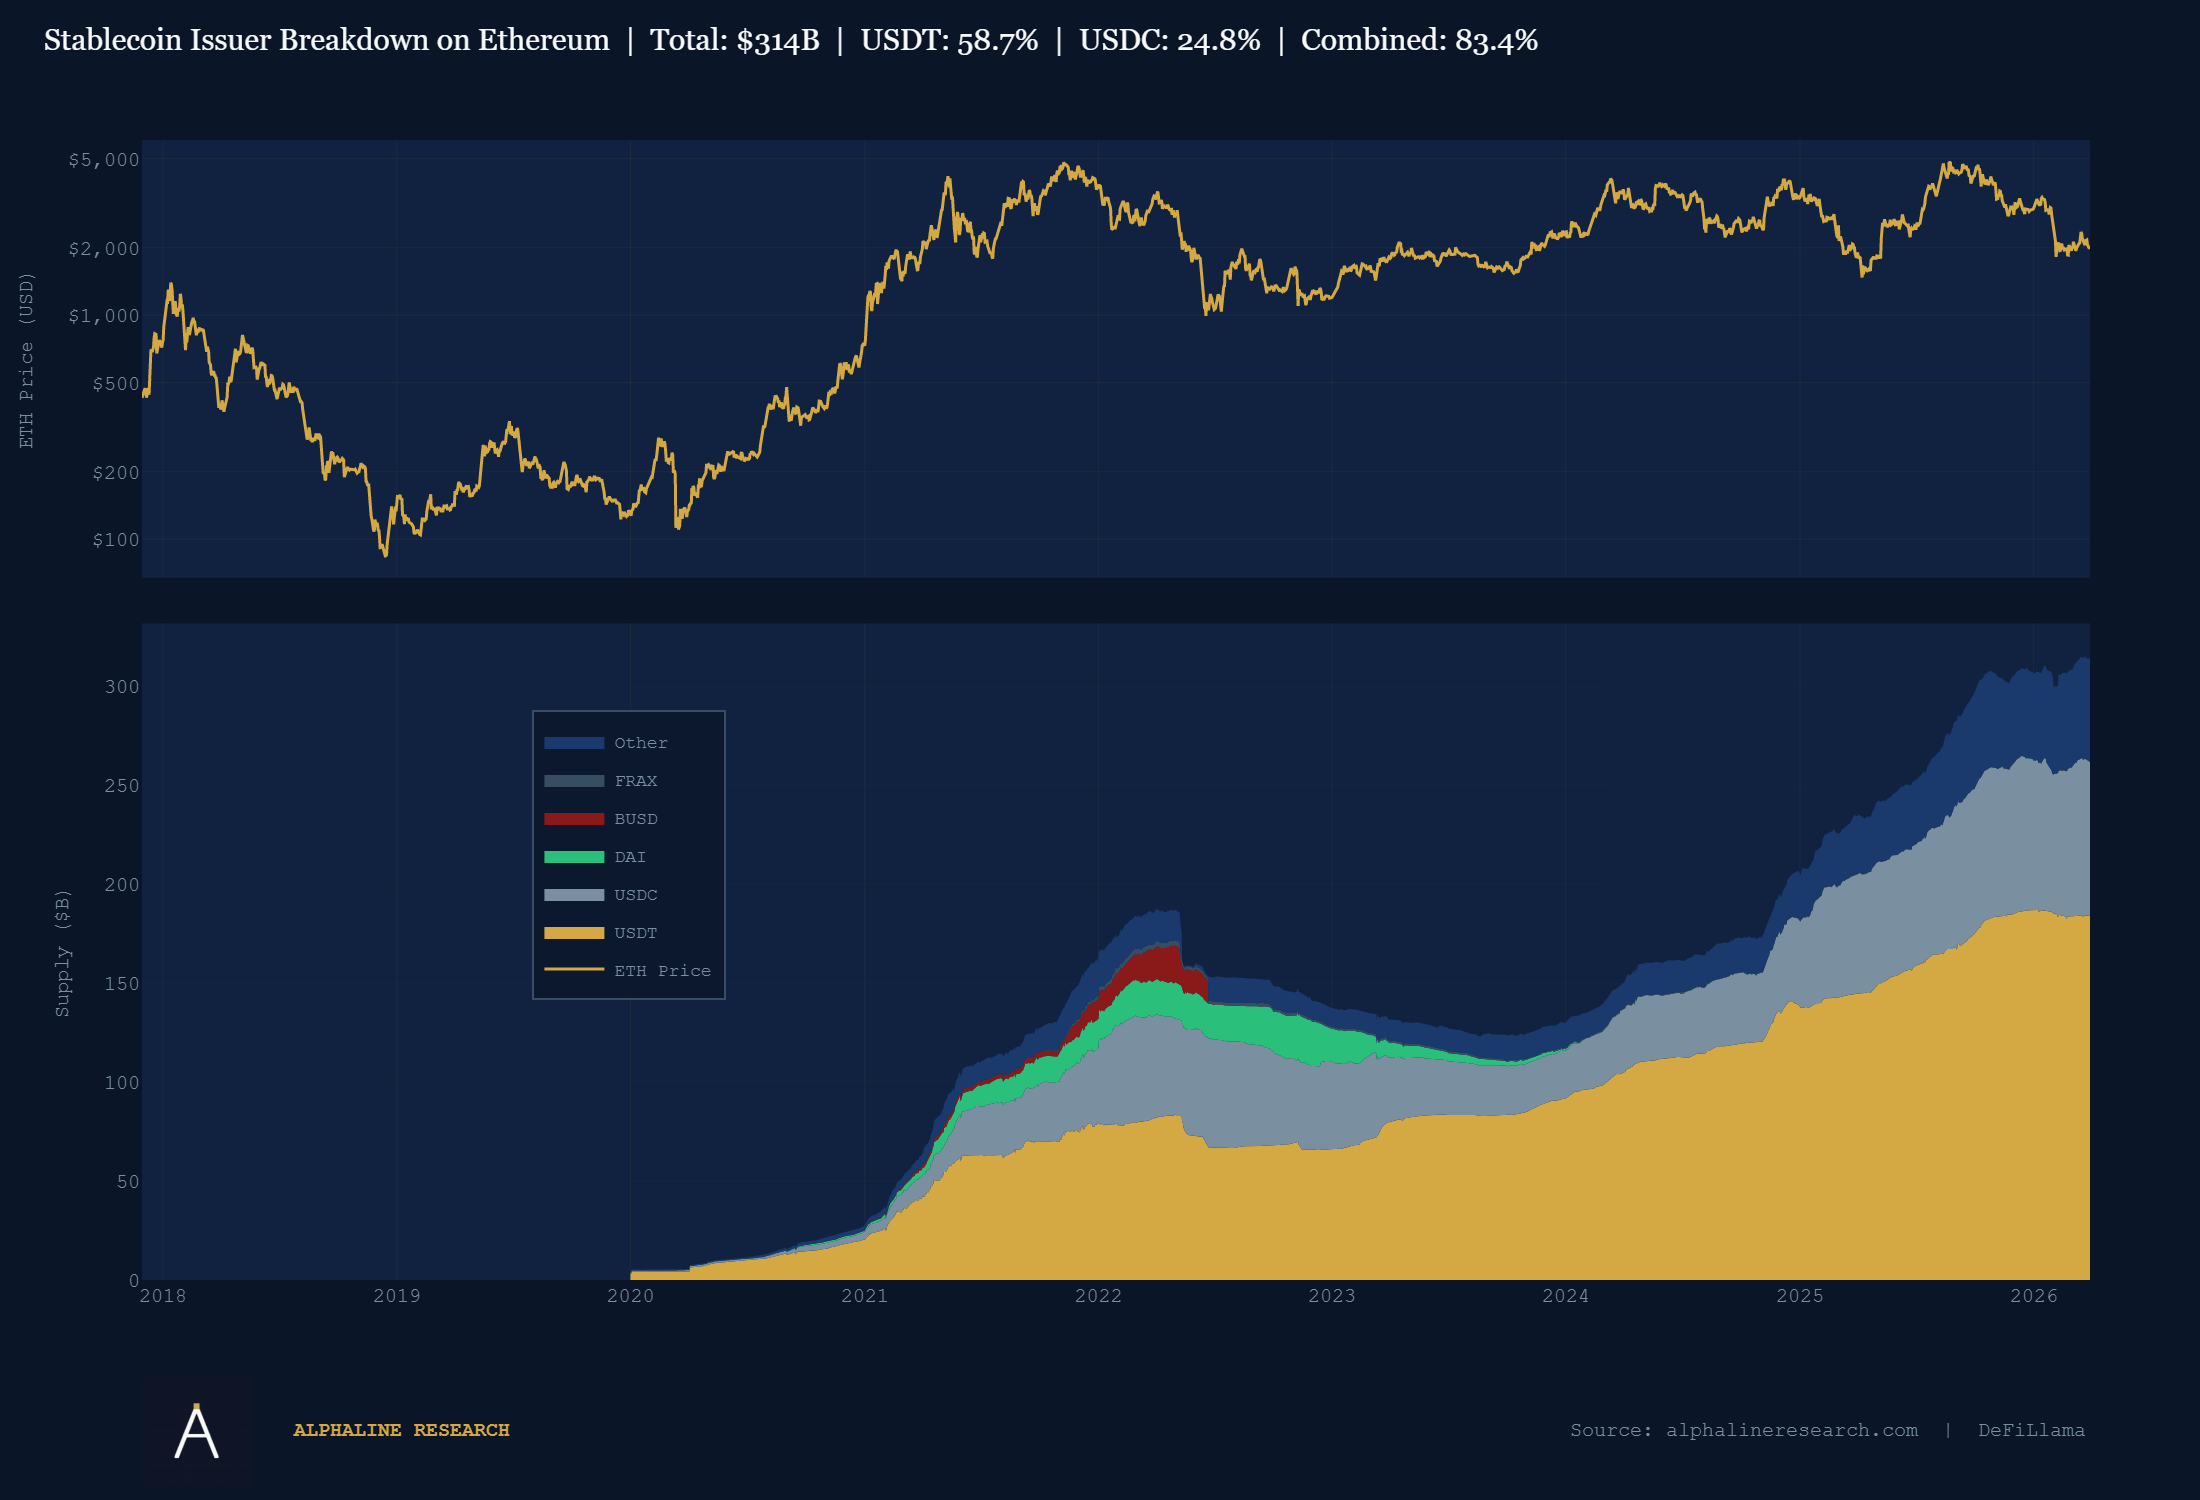
USDT and USDC now make up over 83% of stablecoin supply on Ethereum. In 2021–2022, the distribution was messier — USDC, DAI, BUSD, FRAX all held meaningful share. What's happened since is consolidation toward the two issuers that institutional counterparties can actually get comfortable with from a compliance standpoint.
USDC matters here specifically. Circle has US banking relationships, NYDFS oversight, is traded publicly, and has a client list that includes BlackRock, JPMorgan, and Fidelity. USDC's growing share of Ethereum stablecoins is a direct proxy for institutional capital coming onto the chain. That share has been rising.
This isn't the retail stablecoin story from 2021. The composition of who's bringing dollars onto Ethereum has changed.
The ratio near its ceiling
The stablecoin TVL to ETH market cap ratio currently sits at 0.69. To put that in context: it's at the 99th percentile of all readings in Ethereum's history. The ceiling — the level this ratio has hit and reversed from repeatedly — is around 0.78–0.80.
Every time this ratio has approached 0.80, one of two things has happened: ETH price has recovered, or stablecoin growth has stalled. The ratio has never sustainably broken above 0.80 for long. The security budget logic above is probably why.
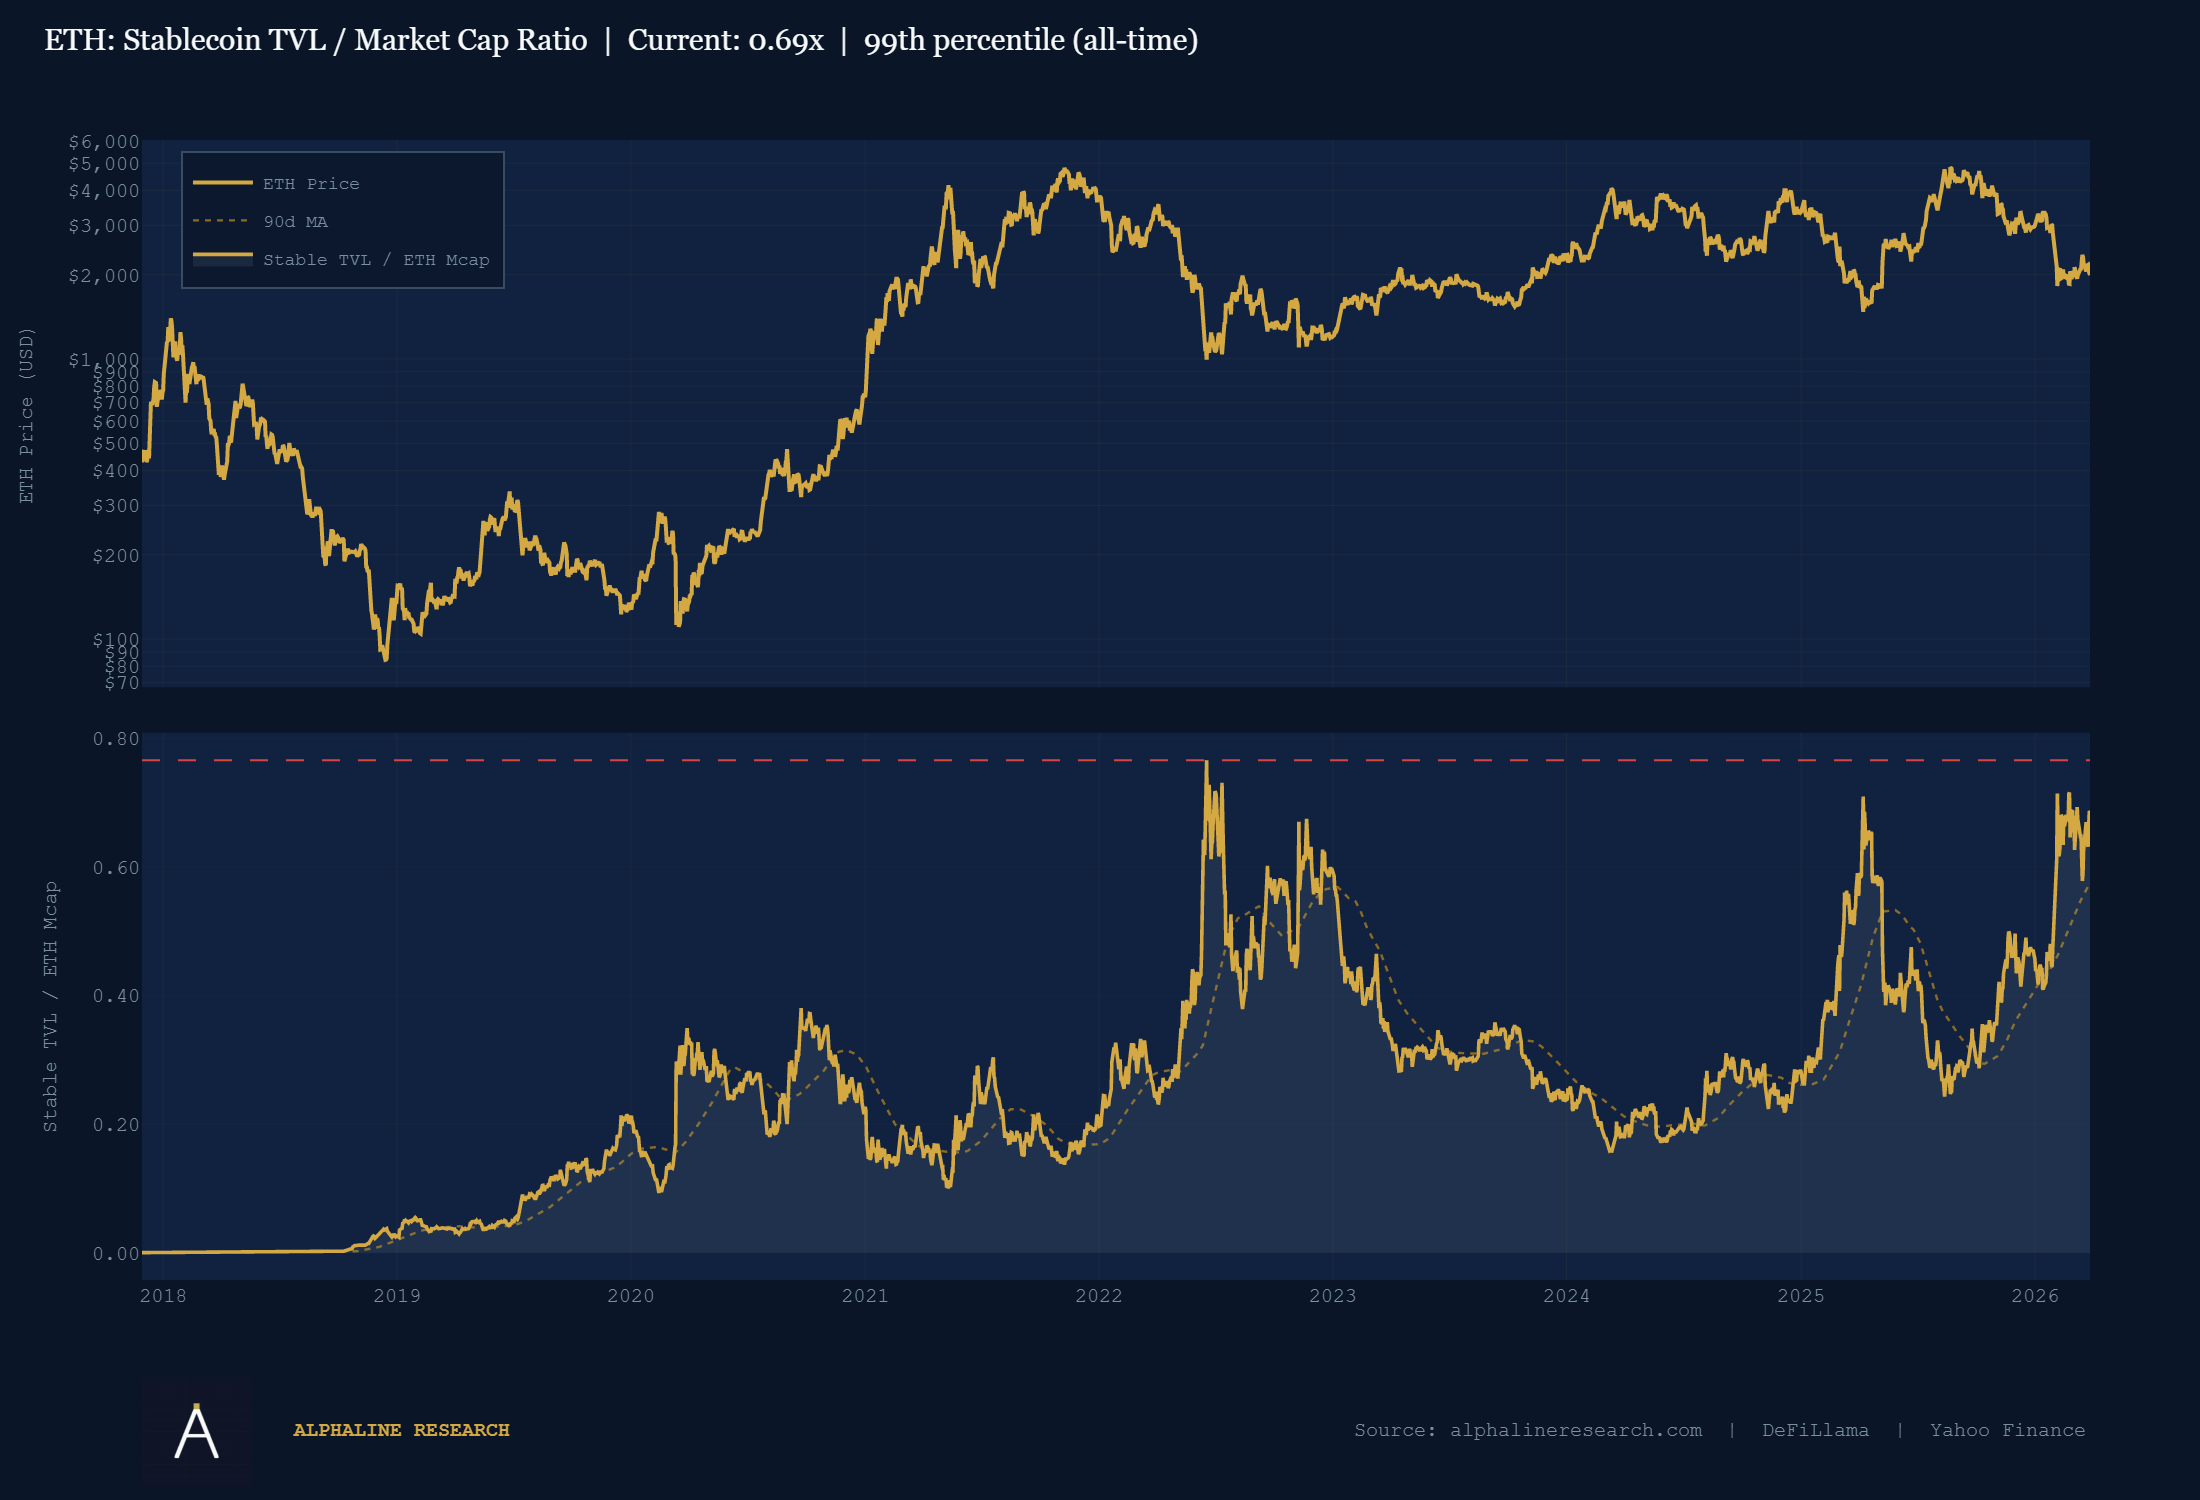
At 0.69 and rising, we are close to that ceiling again. With stablecoins near an all-time high and ETH price still suppressed, the ratio is getting there from an unusual direction — not because stablecoin growth is running hot, but because ETH price has lagged badly enough to let it catch up.
The model, and what it's saying
Taking stablecoin TVL as the primary input, I built a regression model for ETH fair value. The methodology is straightforward: fit historical ETH price against the 30-day moving average of the TVL/Mcap ratio, derive a model price, and track the deviation from that model over time.
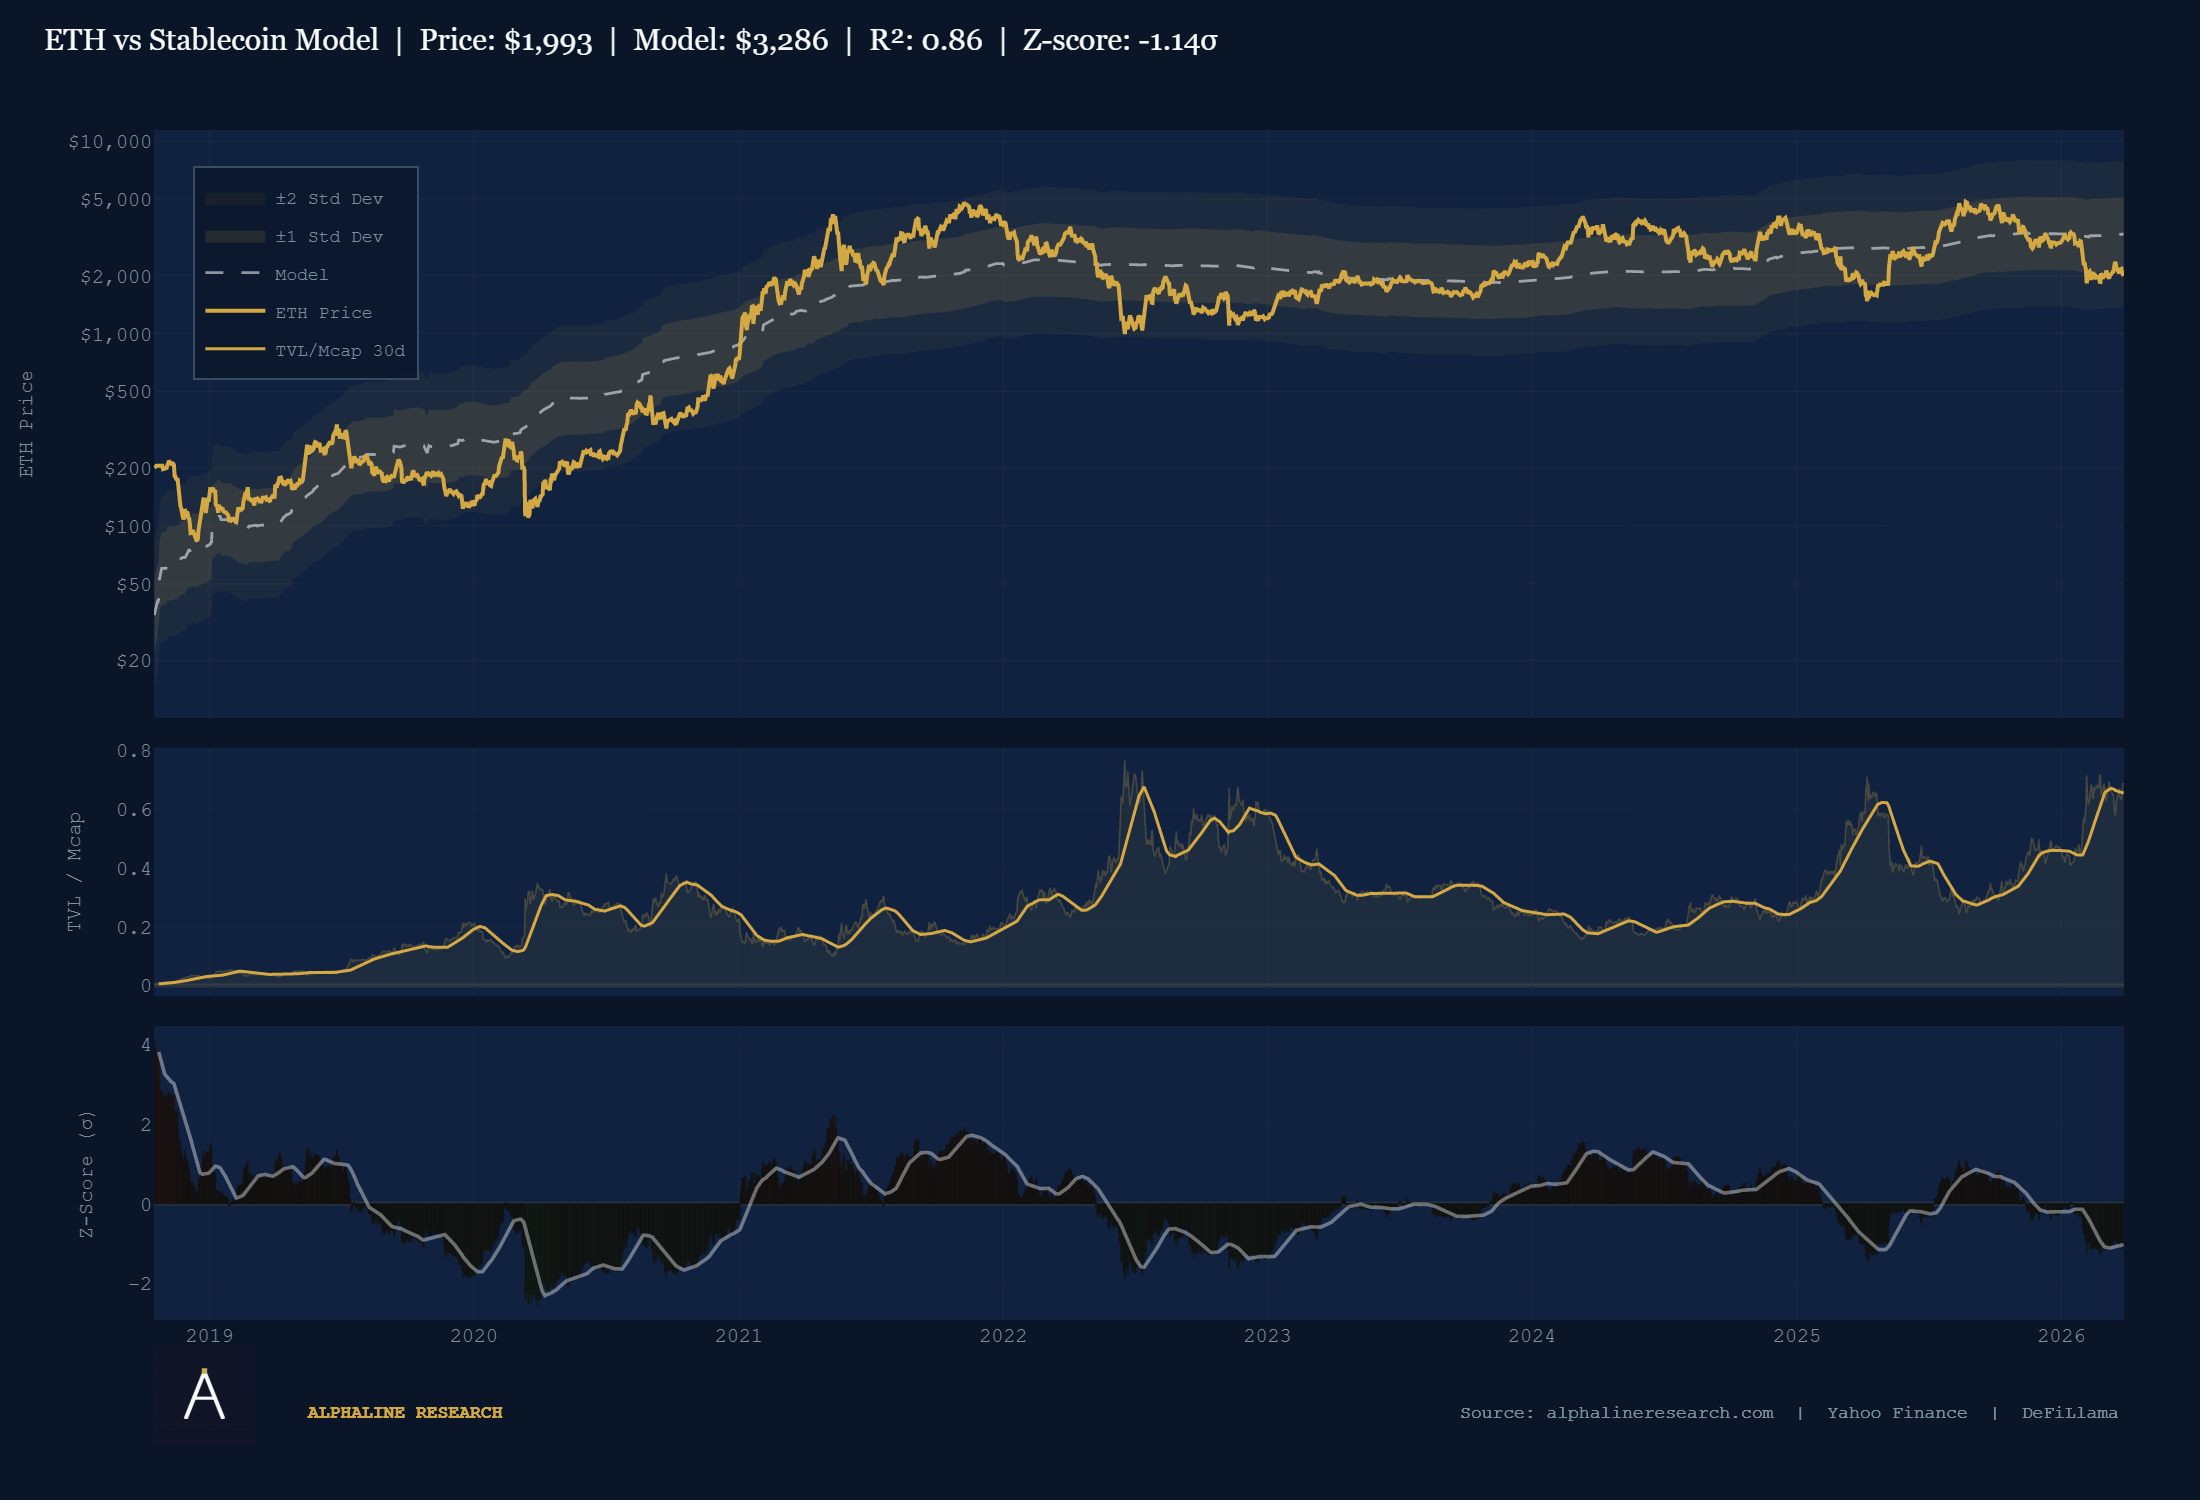
The model's R² is 0.86 — meaning stablecoin TVL explains about 86% of the variation in ETH's price historically. That's not as high as the old fee model's fit on pre-4844 data, but I believe it's more durable, because it's built on a signal that EIP-4844 didn't break.
Current model price: $3,286. Spot: $1,993. The Z-score — a measure of how far the current price is from what the model expects, in units of historical volatility — is −1.14. Negative means ETH is trading below model price. The last time the Z-score was this negative for a sustained stretch was late 2022, and before that, 2020.
Models are wrong in the short term constantly, and this one will be too eventually. What it tells investors is direction and magnitude. The market is pricing ETH at a significant discount to what the network's on-chain fundamentals would imply. That discount has been widening while fundamentals improve.
Each time ETH has sold off since 2023, the fundamental floor was higher than the last time. Price hasn't followed yet.
What I'm actually watching
The thesis breaks if USDT recaptures share from USDC — that would weaken the institutional adoption signal. It also breaks if Ethereum starts losing stablecoin share to other chains. Tron has competed for USDT volume for years, and Solana is making a push. If Ethereum's share of total stablecoin supply starts declining meaningfully, the premise weakens at the foundation.
None of those things are happening right now. Stablecoin supply on Ethereum is at an all-time high. Institutional issuers are growing. And ETH is priced as though the narrative is broken.
The fee model was the right framework for Ethereum in 2020. It stopped being right in 2024, and I think a lot of the confusion around ETH's price since then comes from analysts still using it. The stablecoin security model isn't a perfect replacement. But it fits the data, it fits the institutional incentive structure, and it points in a clear direction.
Fundamentals are making higher lows. Price hasn't caught up.